Table of Contents (Click to expand/collapse) 1. What is FlowStorm and Why Should You Care? 1.1. Brief Overview of FlowStorm’s Capabilities 2. Your First Project with FlowStorm – A
Table of Contents (Click to expand/collapse)
- 1. What is FlowStorm and Why Should You Care?
- 2. Your First Project with FlowStorm – An Interactive Tutorial
- 2.1. Setting up the Environment
- 2.2. Launching and Initialization
- 2.3. Basic Instrumentation
- 2.4. Record your first expression
- 2.5. Navigating the Recording
- 2.6. Working with Multiple Traces in a Single Flow
- 2.7. Organizing Work with Multiple Flows
- 2.8. Dealing with Exceptions
- 2.9. Diving Into a More Complex Example with Quil
- 2.10. Working with Threads
- 2.11. Defining Values
- 2.12. Advanced Navigation: Quick Jump & Power Step
- 2.13. Custom Data Visualization
- 2.14. Use of the Call Tree Tool
- 2.15. Use of the Function List
- 2.16. Saving Positions: Bookmarks
- 2.17. Sending Data to the Output Tool with tap>
- 2.18. Using the Printers Tool
- 2.19. Search in Traces
- 3. Conclusion
- 4. Some Additional FlowStorm Features worth mentioning
1. What is FlowStorm and Why Should You Care?
Ever found yourself lost in a cascade of println statements, desperately trying to understand how data transforms across your Clojure functions? Or you’ve battled elusive bugs that only surface under specific, hard-to-reproduce conditions? If these scenarios sound familiar, you’re in for a treat.
In a previous article, https://flexiana.com/news/2025/04/why-clojure-developers-love-the-repl-so-much, I mentioned some tools for examining data and code. Since 2023, one of them has become essential in my projects: FlowStorm.
1.1. Brief Overview of FlowStorm’s Capabilities
FlowStorm started as a tracing debugger but has evolved into something far more ambitious. Its description as “Much more than a debugger” is apt, as it offers a suite of visualization, interactive exploration, and deep code understanding capabilities that most other programming languages don’t provide.
Think of it: the ability to effortlessly trace data flows, step through execution, and visualize complex states without peppering your code with temporary debug lines. This is the power FlowStorm brings to your Clojure(Script) development.
Here’s a quick look at its features:
- CLJ / CLJS / Babashka support: FlowStorm works with most Clojure types. Although some features, like automatic setup, work a bit differently on ClojureScript.
- Execution Recording: It records how your Clojure code runs. Usually, you don’t need to change your code or do a lot of setup, especially with ClojureStorm.
- Timeline Navigation: Lets you go through the recorded history of your code. You can step forward and backward or jump to specific spots.
- Data Visualization: Has tools to look at your application’s data as it was when the code ran. It has built-in viewers, and you can make your own.
- Code Analysis Tools: Includes things like call-stack trees, function call summaries, and search to help you see how your program ran.
- REPL Integration: FlowStorm and your REPL work together in both directions: you can send values and states from FlowStorm to your REPL, and also access FlowStorm’s recordings and internals from within your REPL.
- Extensibility: Supports plugins and custom tooling (detailed in “Additional Features” section)
FlowStorm can be integrated into your workflow in two ways. The recommended approach is “ClojureStorm,” which swaps your Clojure compiler at dev time for automatic instrumentation. Alternatively, “Vanilla FlowStorm” lets you add FlowStorm to your dev classpath and instrument by tagging and re-evaluating forms. In this tutorial, we’ll walk through the core features of FlowStorm with hands-on examples, from basic setup to advanced debugging techniques.
2. Your First Project with FlowStorm – An Interactive Tutorial
Before you start: This tutorial assumes you have a Clojure setup, know basic Clojure, and how to use a REPL.
In this tutorial, I will guide you from the most simple to the more advanced features step by step. If you ever get lost or you would like to try a different tutorial, there is own offered by FlowStorm itself and accessible via “Help” -> “Tutorial”.
2.1. Setting up the Environment
- To create a project, run two following commands in your terminal:
mkdir fs-example
cd fs-example
cat << EOF > deps.edn
{:paths ["src/"] ; where your cljd files are
 :deps {quil/quil {:mvn/version "4.3.1563"}}
 :aliases {:dev {:classpath-overrides {org.clojure/clojure nil}
                 :extra-deps {com.github.flow-storm/clojure {:mvn/version "1.12.0-9"}
                              com.github.flow-storm/flow-storm-dbg {:mvn/version "4.4.1"}}}}}
EOF
- Create a default user namespace:
mkdir dev
cat << EOF > dev/user.clj
(ns user
  (:require [quil.core :as q]))
EOF
Note: You can create a global alias or lein profile so you don’t need to modify your project’s source files like we do here.
2.2. Launching and Initialization
- Navigate to
fs-exampleproject and launch a REPL with:devalias - If you use Emacs + Cider, this can be done by pressing
C-u C-c M-jand adding:devto the end of the prompt in the minibuffer. - Then evaluate
/dev/user.cljnamespace and execute:dbgin REPL. - You should now see the FlowStorm main window pop up.
2.3. Basic Instrumentation
With the project and REPL set up and FlowStorm started, we can try its basic features:
instrumenting code and recording it.
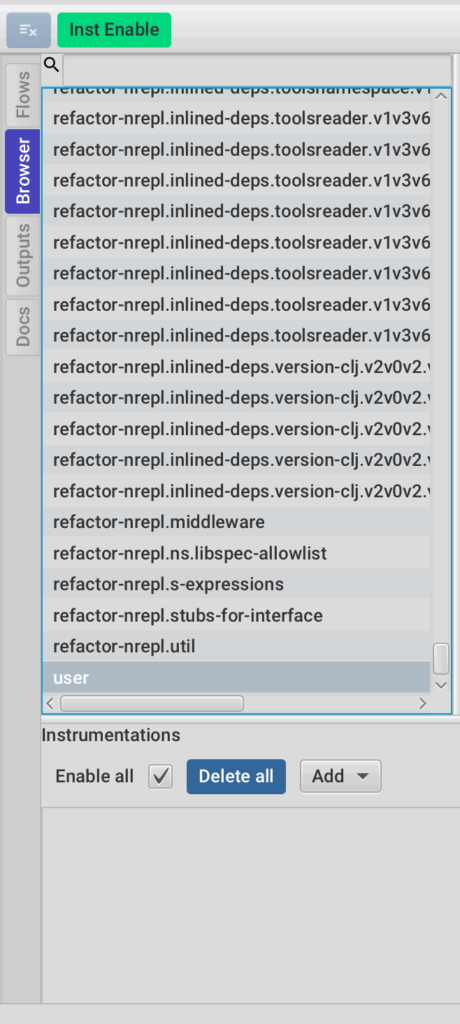
- On the left side of main window, you’ll find several tools. Click on “Browser” (see Figure 1).
The Browser tool lists all loaded namespaces in your application. If you correctly evaluated your user.clj file which requires quil, you should see several quil namespaces and your user namespace. You can select any namespace to see its functions, their argument lists, and potentially their docstrings. When looking at the list of namespaces, you’ll notice that library namespaces are also included. FlowStorm is an excellent tool for understanding how libraries work – you don’t have to limit yourself to just examining your code.
For this tutorial, we will instrument our user namespace.
- Right-click on the
usernamespace in the Browser list.
From the menu, select “Add instr prefix for user.*”.
This tells FlowStorm to instrument all functions in the user namespace.
Note: FlowStorm also lets you say which namespaces to instrument with a JVM property.
2.4. Record your first expression

- After instrumenting the user namespace, switch from the “Browser” tool back to the “Flows” tool on the left side of the FlowStorm window.
- In the “Flows” tool interface, you will see a record button (see Figure 2). Click the “Record” button to start capturing instrumented function calls.
(If you don’t know what some FlowStorm button does, you can usually hover over it and get a tooltip.) - With recording active, let’s feed FlowStorm its first bite of code. We’ll start with something simple.
Return to your REPL and run a simple Clojure expression, for example:(+ 1 2 3) - When this runs, an entry should show up in the “Flows” window. This is the trace of the + function call.
2.5. Navigating the Recording
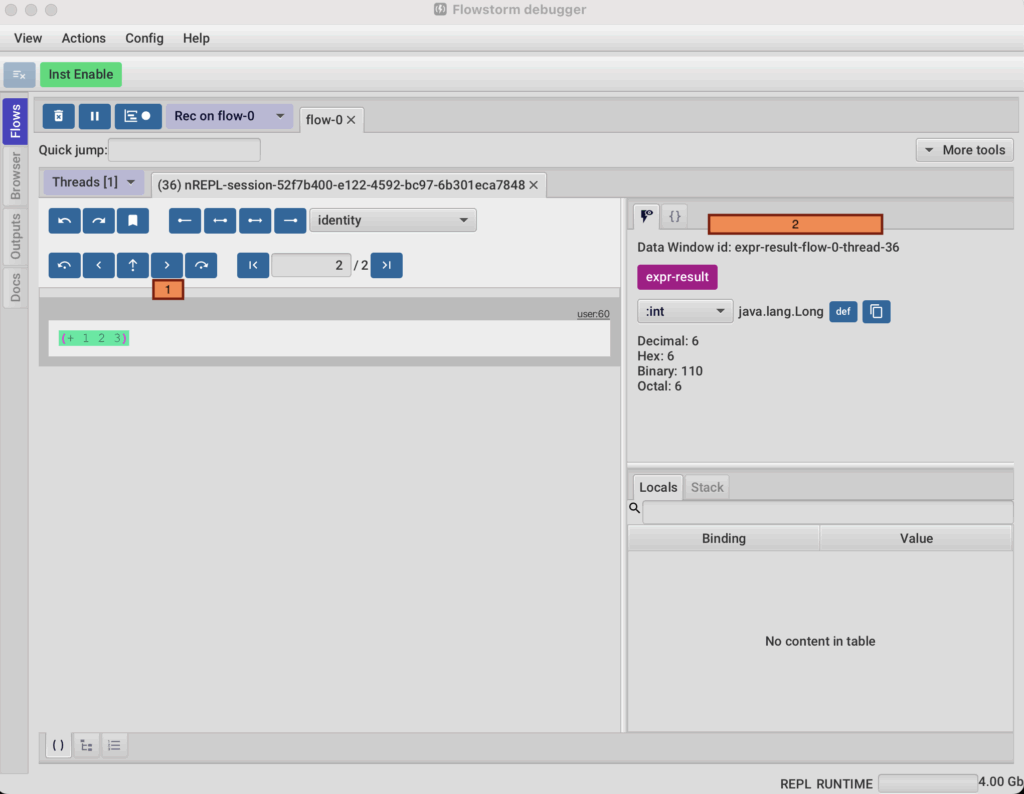
- You will see the recording of (+ 1 2 3) in the “Flows” window. Above the code form, there are buttons for navigation. Click on the button with a simple right arrow (1 in Figure 3) to step into the details of the form’s execution.
- Now, direct your attention to the ‘Data Window’ on the right. This is your interactive lens into the runtime values of your code (2 in Figure 3). You can see this data in different ways; use the dropdown menu in the “Data Window” (it says
:intby default).
2.6. Working with Multiple Traces in a Single Flow
FlowStorm records traces one after another in the current “flow” (one recording session).
- (OPTIONAL) Click the “Pause” button (which replaces the “Record” button when recording) to stop the active recording.
- (OPTIONAL) Click the “Record” button again to continue recording in the same flow.
- Return to your REPL and evaluate another expression, for instance:
(+ 2 3 4) - You will see that the number of recorded steps in the current flow increases. You can navigate this new trace like the first one.
2.7. Organizing Work with Multiple Flows
As your debugging sessions get more involved, you might be investigating different features or bugs simultaneously. Instead of one massive, confusing trace, FlowStorm lets you organize your work into multiple ‘Flows’.
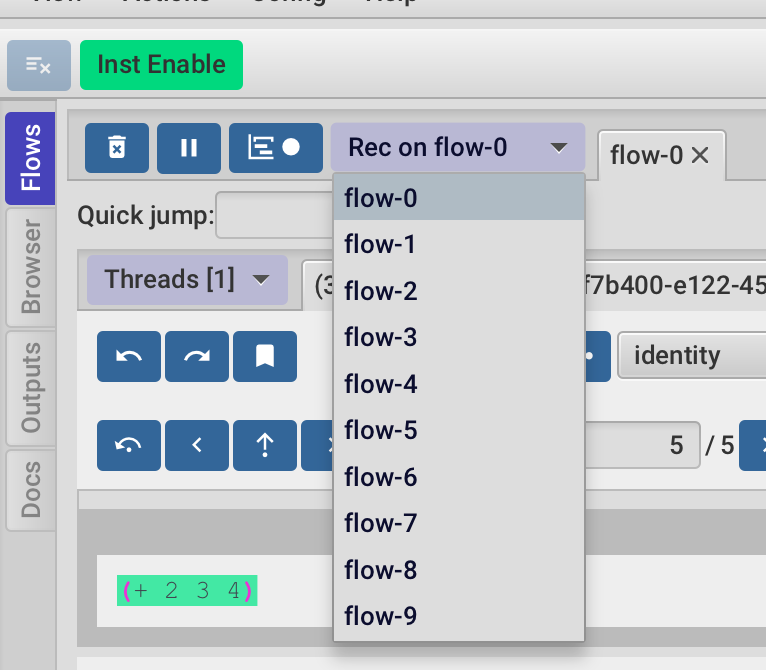
If you want to have a new recording in a different “Flow”, you can pick another one (see Figure 4) and switch between them. They help organize different debug sessions.
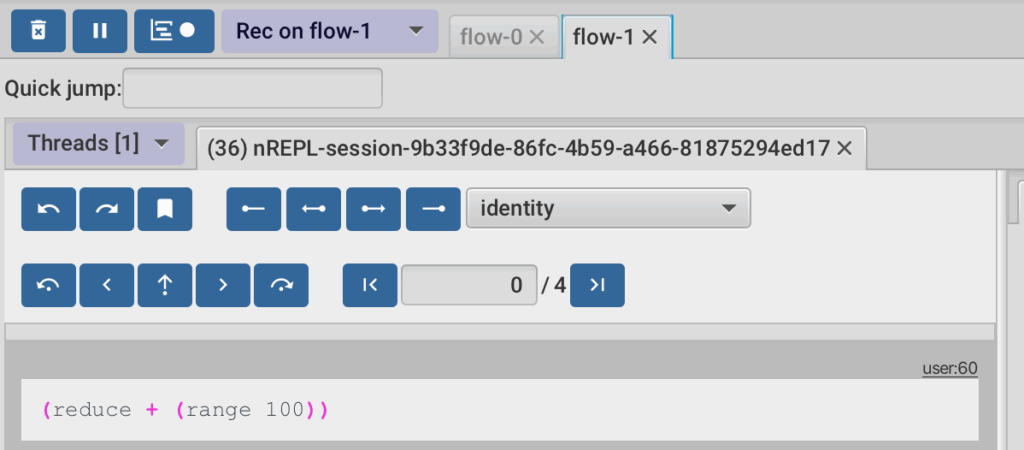
- Let’s select another flow, e.g.,
flow-1 - Click
Record(if it is not already on). - In your REPL, evaluate a simple expression like
(reduce + (range 100)) - Observe this new trace in
flow-1(see Figure 5), You can switch flows anytime.
2.8. Dealing with Exceptions
Let’s face it, exceptions happen, and Flowstorm has a good way to navigate them.
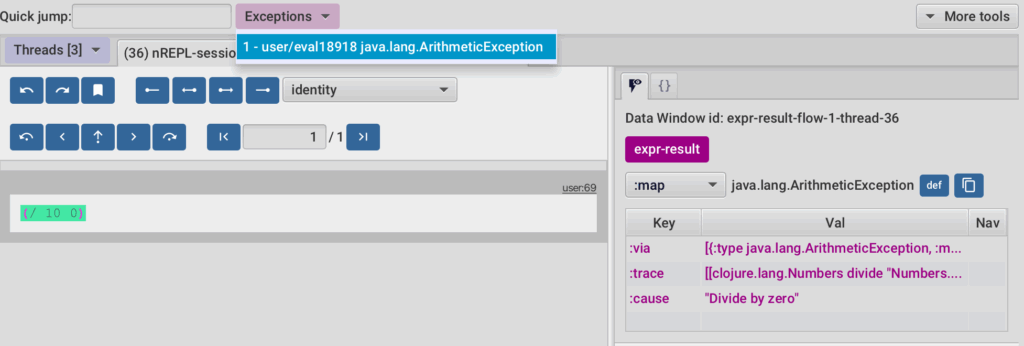
- Go back to your REPL and run:
(/ 10 0) - An exception drop-down will appear in “Flow” (see Figure 6). You can easily go to where the exception happened.
2.9. Diving Into a More Complex Example with Quil
Simple math is useful for a first look, but FlowStorm shines when dealing with more complex code. Let’s use a Quil example to explore further.
- Open your
user.cljfile in your editor and add the following Clojure code. It defines a simple Quil sketch.
(defn setup []
  (q/frame-rate 1)      ;; Set framerate to 1 FPS
  (q/background 200))   ;; Set the background colour

(defn make-ellipse [x y diam]
  (q/ellipse x y diam diam))

(defn draw []
  (q/stroke (q/random 255))             ;; Set the stroke colour to a random grey
  (q/stroke-weight (q/random 10))       ;; Set the stroke thickness randomly
  (q/fill (q/random 255))               ;; Set the fill colour to a random grey

  (let [diam (q/random 100)             ;; Set the diameter to a value between 0 and 100
        x    (q/random (q/width))       ;; Set the x coord randomly within the sketch
        y    (q/random (q/height))]     ;; Set the y coord randomly within the sketch
    (make-ellipse x y diam)             ;; Draw a circle at x y with the correct diameter
    ))

(q/defsketch fs-example            ;; Define a new sketch named example
  :title "Oh so many grey circles" ;; Set the title
  :settings #(q/smooth 2)          ;; Turn on anti-aliasing
  :setup setup                     ;; Specify the setup fn
  :draw draw                       ;; Specify the draw fn
  :size [323 200])                 ;; Set the sketch size
Before re-evaluating the namespace and running the Quil sketch:
- In FlowStorm, click the “Clean all flows” button (on the left of the recording button) to clear all existing recordings.
- Make sure the recording is on by clicking the “Record” button.
- Now reload the
usernamespace.
When the user namespace is evaluated and the sketch starts, a window titled “Oh so many grey circles” should appear, drawing circles. FlowStorm will begin to capture traces related to the draw and setup functions, because they are in the instrumented user namespace. You might see about 34 steps recorded.
2.10. Working with Threads
If you step through the traces after the sketch starts, you might not see much about the animation. This is because the Quil animation (the draw loop) usually runs in its own thread.
FlowStorm makes navigating between threads a breeze:
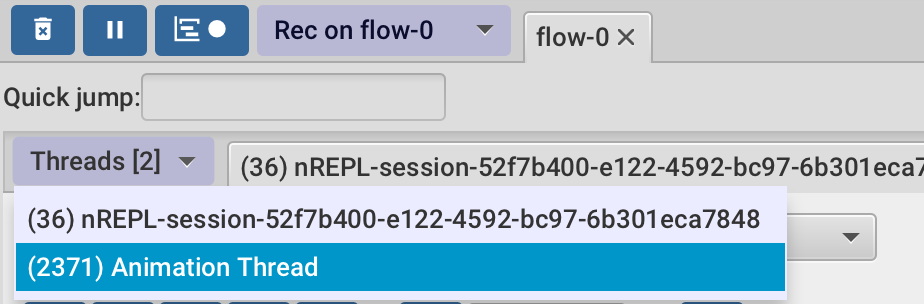
- Click on the “Threads” dropdown in FlowStorm “Flow” window.
- You should see a list of threads. Select the thread responsible for the animation (see Figure 7; it should be named “Animation Thread”).
- Once the animation thread is selected, you will see the traces generated by the
setupanddrawfunction calls, accumulating as the animation runs (if recording is still active). You can stop it now.
TIP: FlowStorm can show all threads in one window. To do that, start recording by clicking on “Start recording of the multi-thread timeline” next to the “Record” button and then select “Multi-thread timeline browser” under “More tools”.
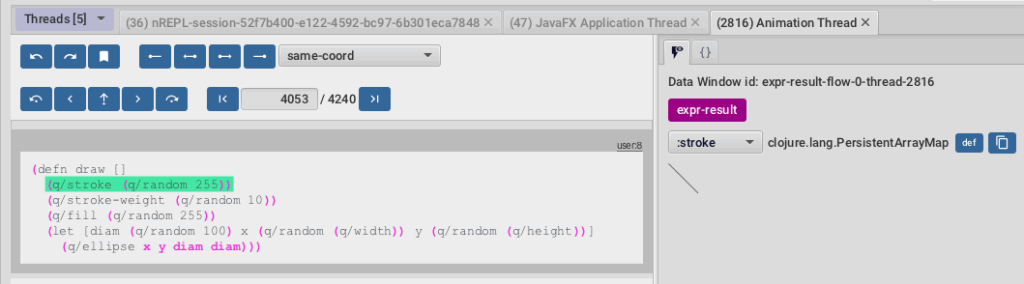
2.11. Defining Values

Spotted an interesting piece of data in a trace? Why not pull it directly into your REPL?
- Navigate through the traces in the animation thread until you find a call to a Quil function
q/stroke. In the “Data Window” on the right, you’ll see the value ofq/strokeis a Clojure map (clojure.lang.PersistentArrayMap). - Suppose you want to inspect or manipulate this specific map in your REPL. FlowStorm lets you define any displayed value as a variable in your
usernamespace (or any other). With the value selected in the “Data Window”, click the “def” button (see Figure 8). - You’ll be prompted to give the new var a name. Enter a name (e.g.,
my-stroke-data)
This value is now available in your user namespace in the REPL under the name you provided, allowing you to interact with it directly.
2.12. Advanced Navigation: Quick Jump & Power Step
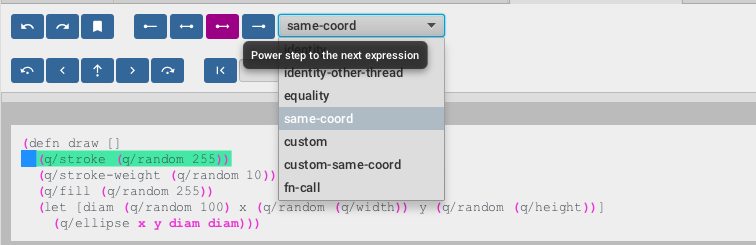
As your application runs, traces can grow quite long. Manually stepping through hundreds or thousands of evaluations isn’t efficient. Say you are looking at q/stroke call and want to see the q/stroke call for the next circle drawn, without manually stepping through everything. This is where “Power Step” is useful. The “Power Step” feature has several modes. Here, we want to jump to the next time a function is called at the same place in the code (like the q/stroke line in your draw function).
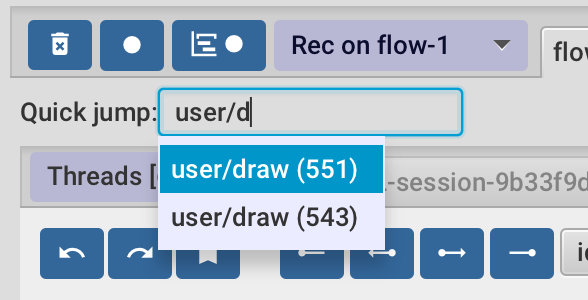
- Make sure you are on a
q/strokecall in the trace view. You can use the “Quick Jump” feature (see Figure 9) – typeuser/drawthere and pick the function (with an amount of calls next to it). It will take you to the function. Then move two steps more and you should be onq/stroke. - Pick the
same-coordoption from the “Power Step” dropdown menu and click the “Power Step forward” button (highlighted in Figure 10). - FlowStorm will jump to the next time the code at that place (the
q/strokecall in draw) runs. You can see in the “Data Window” how values (like:current-strokein the map) changed for the new circle.
2.13. Custom Data Visualization
FlowStorm’s default data view is useful, but sometimes a custom view gives better insight, especially for domain-specific data. Let’s make one for our Quil stroke.
Looking at the q/stroke data (a map with color info), it’s just numbers. It would be more intuitive if we could see the actual color represented visually. FlowStorm allows custom visualizers for this purpose.
- Add the following code to your
user.cljnamespace. It registers a new visualizer for data that represents a Quil stroke. It uses JavaFX (which FlowStorm’s UI is built with) to draw a line with the stroke’s color.
(require '[flow-storm.api :as fsa])
(require '[flow-storm.debugger.ui.data-windows.visualizers :as viz])
(require '[flow-storm.runtime.values :as fs-values])
(import '[javafx.scene.shape Line]
        '[javafx.scene.paint Color])


(viz/register-visualizer
 {:id :stroke ;; name of your visualized
  :pred (fn [val] (and (map? val) (:quil/stroke val))) ;; predicate
  :on-create (fn [{:keys [quil/stroke]}]
               {:fx/node (let [gray (/ (first (:current-stroke stroke)) 255) ;; gray normalization
                               color (Color/gray gray)
                               line (doto (Line.) ;; draw line
                                      (.setStartX 0.0)
                                      (.setStartY 0.0)
                                      (.setEndX 30)
                                      (.setEndY 30)
				      (.setStrokeWidth 5.0)
                                      (.setStroke color))]
                           line)})})


(fs-values/register-data-aspect-extractor ;; extract data from q/stroke
 {:id :stroke
  :pred (fn [val _] (and (map? val) (:current-stroke val)))
  :extractor (fn [stroke _] {:quil/stroke stroke})})


(viz/add-default-visualizer (fn [val-data] (:stroke (:flow-storm.runtime.values/kinds val-data))) :stroke)
- If the Quil sketch window (“Oh so many grey circles”) is still open, close it.
- In FlowStorm, clear any existing recordings.
- Make sure the recording is on.
- Re-evaluate your
usernamespace (which should restart the Quil sketch).
Now, when you go to a trace involving q/stroke (or more precisely, the data map that contains the stroke information) in the animation thread, you should see a short line whose color matches the stroke color used for a circle (see Figure 11).
If you use “Power Step” (set to same-coord) to jump to the next q/stroke data, you should see the color of the line in the custom visualizer change accordingly.
Custom visualizers provide significant power. For even more advanced customization or integration with external tools, FlowStorm also supports a plugin system. Exploring plugins is beyond the scope of this initial tutorial, but it’s a feature to be aware of for future needs.
2.14. Use of the Call Tree Tool
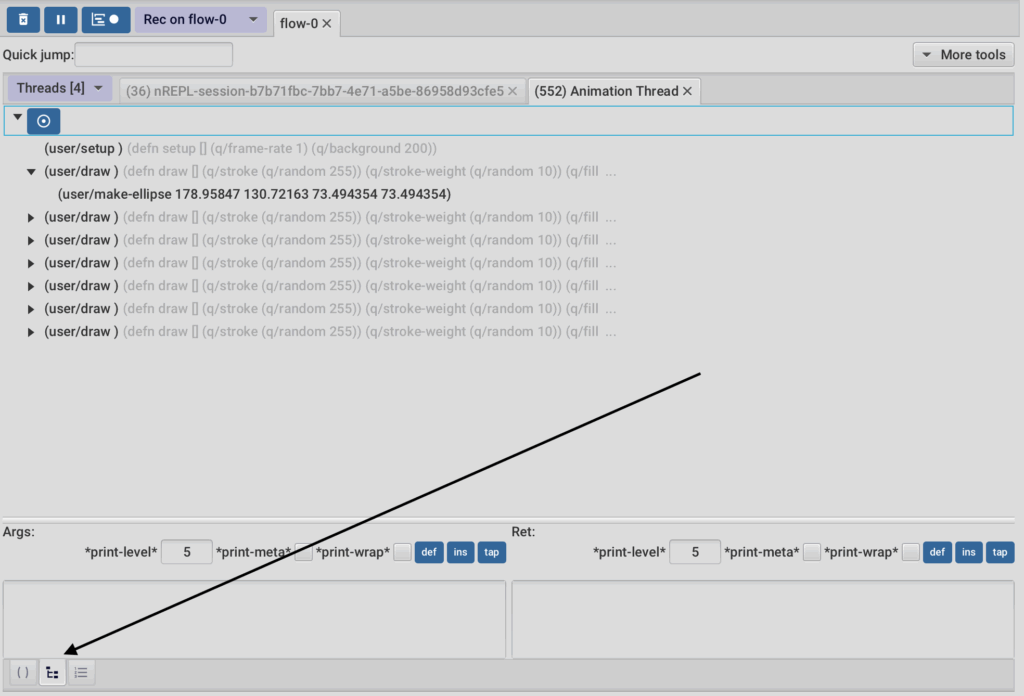
Stepping line-by-line shows what happens, but how does it all fit together? The “Call Tree” tool shows a tree of function calls from a recording. This helps understand the structure of how the code runs and how functions call each other. The tree displays arguments or return values to help differentiate between multiple calls to the same function.
- Keep the animation thread selected and open the “Call Tree” tool (see Figure 12).
- The tool will display a tree. Look for repeated calls to
user/drawor other functions from your sketch, likeuser/setup. - Click on one of the
user/drawnodes in the call tree, and you should see a call to(user/make ellipse). Double-clicking any node takes you to it.
2.15. Use of the Function List

Need a quick summary of all functions that ran, or want to find every single call to user/draw? The ‘Function List’ tool gives you a flat, searchable index of all recorded function invocations.
- Open the “Function List” tool (see Figure 13).
- You’ll see a list of functions. Find entries for functions from your code (e.g.,
user/draw) and library functions that were called (e.g.,quil.core/ellipse,quil.core/random). - Pick a function from the list, for example,
user/make-ellipse. A panel on the right should show all the individual calls of that function that were recorded. For each call, you can see its arguments and what it returned. - Like the “Call Tree” tool, double-clicking on a specific invocation will navigate you to it.
2.16. Saving Positions: Bookmarks
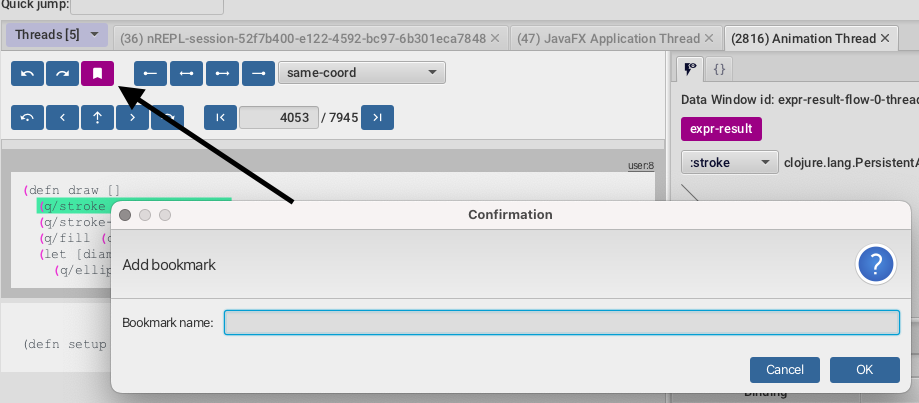
Found a particularly interesting spot in a long trace that you know you’ll want to revisit?
FlowStorm’s bookmarks save your place.
To save a bookmark:
- Go to the step in the trace you want to bookmark.
- Click on the bookmark button in the FlowStorm UI (see Figure 14).
- It will ask for a name for your bookmark. Choose a descriptive name.
Once saved, you can use the bookmark list in FlowStorm (“View” -> “Bookmarks”) to quickly jump back to that exact position in the trace at any time, without needing to manually step through again. You can also make bookmarks in your Clojure code. This lets you mark important points in your program’s run.
Let’s add one to our Quil example.
- First, make sure
flow-storm.apinamespace is available in youruser.cljfile.
Let’s give itfsaalias. - Now change your
setupfunction inuser.cljto include a call tofsa/bookmark:
(defn setup []
  (q/frame-rate 1)
  (q/background 200)
  (fsa/bookmark "Quil setup function complete")) ; <--- Add this line
- Re-evaluate the namespace. Next time
setupruns, a bookmark “Quil setup function complete” will be automatically created, and FlowStorm will jump to it. You can also find this new bookmark in FlowStorm’s bookmark list.
2.17. Sending Data to the Output Tool with tap>
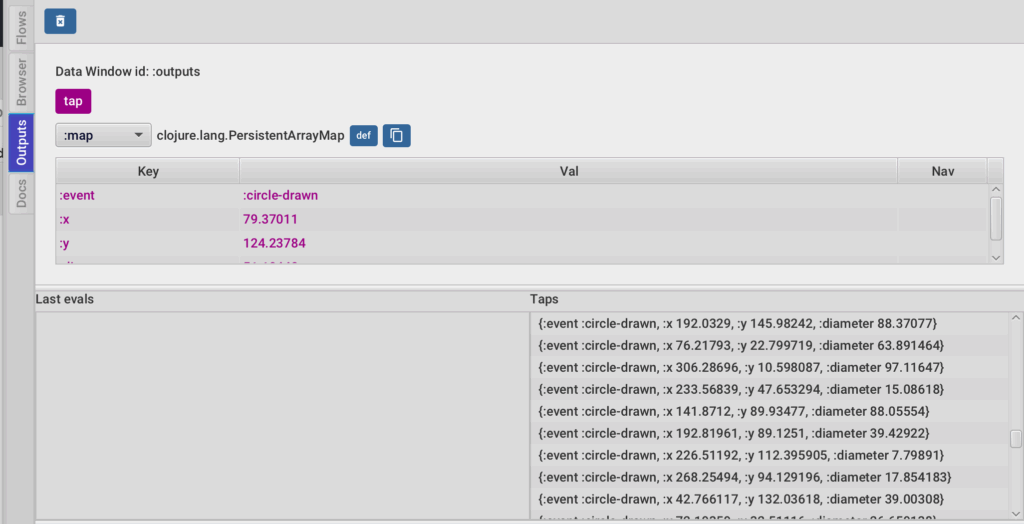
We all know println debugging. While sometimes useful, it can clutter your console and mix with other output. Clojure’s tap> offers a more structured way to inspect values, and FlowStorm can be its dedicated display.
- Modify the
drawfunction in youruser.cljfile totap>the circle’s properties just before it’s drawn.
(defn draw []
  (q/stroke (q/random 255))
  (q/stroke-weight (q/random 10))
  (q/fill (q/random 255))
  (let [diam (q/random 100)
        x    (q/random (q/width))
        y    (q/random (q/height))]
    (tap> {:event :circle-drawn, :x x, :y y, :diameter diam}) ; <--- Add this line
    (make-ellipse x y diam)))
- Re-evaluate your
usernamespace and make sure FlowStorm is recording. - In the FlowStorm UI, find and open the “Output” tool.
- As the Quil animation runs, you should see maps appearing in the “Output” tool. Each map is the data you tapped. This gives a log of data from your
drawfunction (see Figure 15).
2.18. Using the Printers Tool
Sometimes, you want to keep an eye on a specific value or expression as it changes over many executions, without clicking through traces each time. The ‘Printers’ tool is like setting up a persistent watch window, tailored to exactly what you want to see.
- Make sure your Quil sketch is running and you have some traces recorded (e.g., in
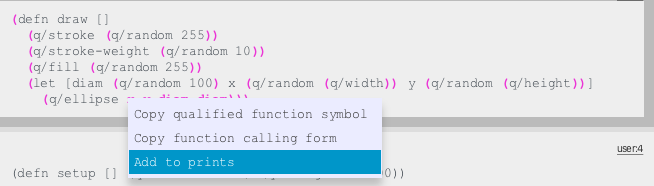
flow-0and the “Animation thread” is selected). - In Flowstorm’s code stepping view, navigate to the traces of the
drawfunction. Right-click onxin(q/ellipse ...)and select “Add to prints” (see Figure 16). - Dialog will show up. You can set up the printer:
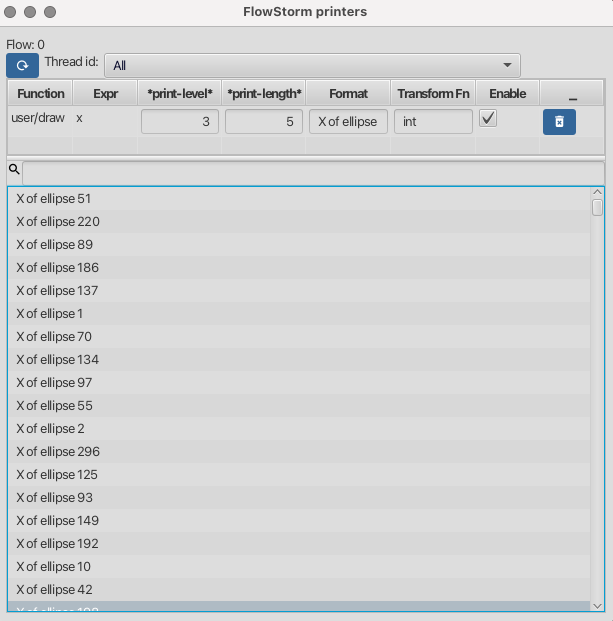
- Message format: Enter a descriptive string that will help you to identify the value, e.g.
X of ellipse - Expression: Used for transforming the value, let’s try
int(that will change floats to integers).
- Message format: Enter a descriptive string that will help you to identify the value, e.g.
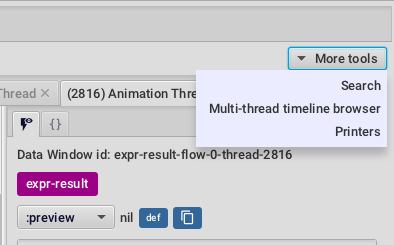
- Confirm the dialog. Now go to “Printers” that is hidden inside “More tools” dropdown in the “Flows” window (see figure 17).
- A new “FlowStorm printers” window with definition of our existing printer will appear (see Figure 18). When you now click the refresh button (top left), you will see the value for every
xtransformed tointthat you recorded. You can always redefine your printers and do this again. Double-clicking any printed value takes you to it.
2.19. Search in Traces

When your traces become vast landscapes of data, finding that one specific value or call can feel like searching for a needle in a haystack. FlowStorm’s search functionality can help you.
- Select the “Search” tool (from “More tools”, see Figure 17). A new “FlowStorm search” window should pop up.
- Search for all the occurrences of the
frame-rate. Typeframe-rateinto the search bar and execute the search. You should see all the occurrences of this key (see Figure 19). - Double-clicking any result takes you to it.
- Feel free to experiment with the remaining search functions like “By predicate” etc.
3. Conclusion
This tutorial showed you FlowStorm’s main features: setting up, first recordings, and using tools like custom views and printers. You saw how FlowStorm can help understand your Clojure code’s execution, making debugging easier.
(Here is a gist with a complete user.clj example.)
The best way to learn is to use FlowStorm in your projects. The more you use it, the more you’ll see how it helps with complex code. The next section gives a quick look at other features. For more details, the official FlowStorm documentation is very helpful.
4. Some Additional FlowStorm Features Worth Mentioning
This tutorial covered many things, but FlowStorm has more. Here’s a quick list of other features. Look at the official documentation for details:
- Metadata Navigation: Lets you see metadata of Clojure data structures in traces.
datafy / navSupport: Works with Clojure’sdatafyandnavto show custom data types better.- EQL Filtering for Data Structures: Use EQL queries to find specific parts of big or nested data.
- Thread Breakpoints: Pause threads at specific functions, can be conditional on arguments (check platform for support ).
- Plugins: Add custom tools or use existing ones like Web Plugin, FlowBook Plugin, CLJS compiler plugin, or Async Flow Plugin.
- Web Plugin – an experimental plugin for visualizing web application flows.
- FlowBook Plugin – allows you to store and replay your flows with an optional “flowbook”, which is a notebook that supports links to your recordings that can be used to explain your flows.
- Flow Storm CLJS compiler plugin – helps you visualize and move around your ClojureScript compilation recordings by representing them as an interactive graph.
- Flow Storm Async Flow Plugin – allows you to visualize your
core.async.flowgraph recorded activity from a graph
- Specific Loop Navigation: Right-click values in loops to jump to other iterations or start/end of loops.
- Output Tool – Capturing
stdoutandstderr. - Remote Debugging: Debug Clojure apps running on other machines, often with SSH.
- Dealing with Too Many Traces (Recording Limits): Set limits for recording functions or threads to control trace size and speed, helps avoid OutOfMemoryError.
- Handling Mutable Values: Use
flow-storm.runtime.values/SnapshotPprotocol to tell FlowStorm how to save the state of mutable values. - Instrumentation Limitations & Control: Know about limits (e.g., very big forms) and use controls to pick what to instrument.
- General Programmable Debugging/Analysis: Use FlowStorm’s APIs (like in
flow-storm.runtime.indexes.api) to look at recorded traces with code from your REPL. - Multi-thread timeline: Records and shows operations from many threads in order. Good for finding concurrency bugs.
- Editor Integration: Works with editors like Emacs (CIDER), VSCode (Calva), and IntelliJ (Cursive) to jump from FlowStorm to your code.
- Styling and Theming: Change UI look with themes (light/dark) or custom CSS.
Curious how advanced debugging and interactive code exploration can improve your Clojure development workflow? At Flexiana, we leverage powerful tools like FlowStorm alongside deep functional programming expertise to build resilient, maintainable software and help teams work smarter.
The post FlowStorm: Debugging and Understanding Clojure Code on a New Level appeared first on Flexiana.